NZD/USD Price Analysis: Struggles for clear direction between short-term key SMAs
- NZD/USD fades bounce off 200-SMA, drops for consecutive second day.
- Weekly horizontal support, immediate falling trend line add filters to moves.
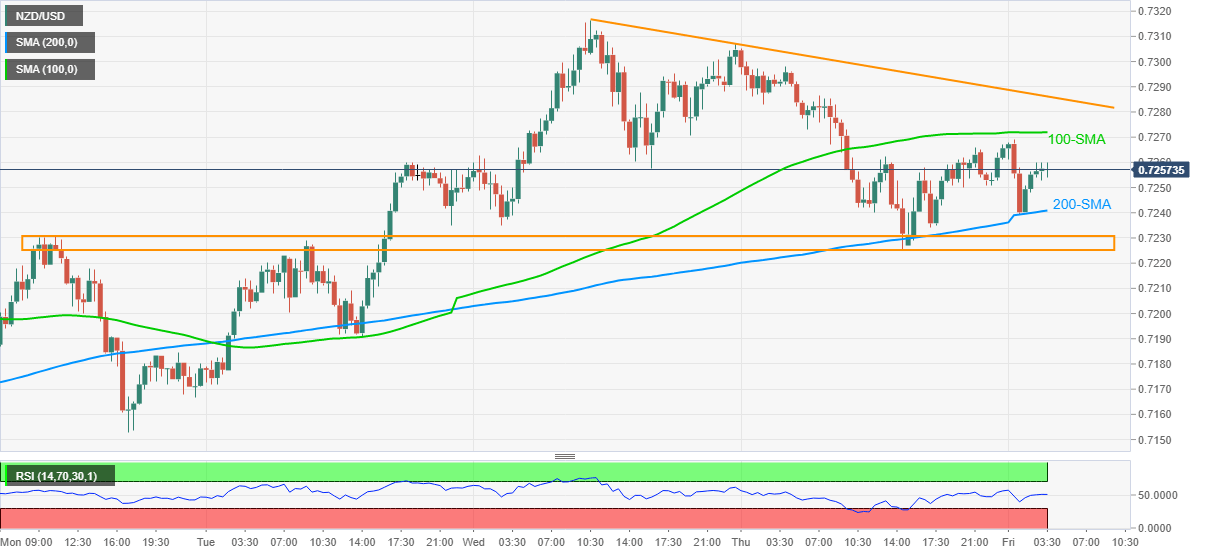
NZD/USD wavers around 0.7255/60 during early Friday. In doing so, the kiwi pair stays between 100 and 200-SMAs on the 30-minute chart while keeping the recent bounce off a horizontal area including multiple highs and lows marked since Monday.
Even so, the upward trajectory marked from early November remains unbeaten and hence bulls are still hopeful on their journey towards the weekly top of 0.7316.
However, a falling trend line from Wednesday, currently around 0.7286 probes the bulls, beyond the 100-SMA level of 0.7271. Also acting as the upside barrier is the 0.7300 round-figure.
It should be noted that any upside past-0.7316 will eye for April 2018 peak surrounding the 0.7400 mark.
On the downside, 200-HMA and the aforementioned horizontal area, respectively around 0.7240 and between 0.7230 and 0.7225, challenges the immediate downside.
In a case where the quote stays below 0.7225, 1n ascending trend line from November 02 near 0.7163 and the weekly low of 0.7153 will be the key to watch.
NZD/USD 30-minute chart
Trend: Bullish